Set up an investment strategy based on research and rankings from top buy-side providers and fundamentals data. Use filters to define the universe of equities that will comprise your strategy and back-test based on up to three years of historical performance. Work in hypothetical mode to adjust the strategy until the historical performance meets your standards, and with the click of a button let the system create the orders to invest in your strategy. Follow your strategy's performance in your portfolio.
Click "Create New Strategy" to open and edit Investment Rules in the sidecar populated with sample data based on the last sorting option you selected. The main Portfolio Builder reflects changes made in the sidecar in real time.
The two-part window comprises a sidecar with various settings, and a full window that displays the results of your setting decisions as you work. Depending on the layout of the users' TWS, the sidecar may display to the right or to the left of the main Portfolio Builder window. Use the scroll bar on the far right side of the sidecar to use all available settings.
Use a hypothetical investment amount or use your account's Current Available Funds, and then specify what percentage of that amount you want to allocate toward creating long and short positions. Long positions allow up to 500% of the investment amount, and short up to 300%. Define restrictions on all or specific stocks. Select Filter by Industry to display the Industry Filter. Specify industries to include in your hypothetical portfolio, and set limits on how much of each industry to include as long and/or short positions.
Define the universe of equities for the strategy to invest. Filter by index and a "last price" range to start, and use the Add Additional Filters drop down list to choose from a myriad of other filter criteria including High/Low/Volume/History, Dividends, Fundamentals and Short Selling. Set a Minimum/Maximum range for all filters, and view the filter and min/max range graphically in each filter's histogram chart.
Select a provider* and use the slider to set the weighting*.
*For information on individual providers and how the "Weights" setting affects how stocks are ranked, see the Ranking Logic and Providers sections below.
*For information on how the position sizing is calculated, see the Ranking Logic section below.
Indicate how you would like the strategy to maintain long and short positions ranked by providers. Selectors let you pick "the top" or "the bottom" and define the number of equities from the ranking to maintain.
Specify whether positions should be established with equal size, or sized proportionally based on weights and rankings.
Specify a time interval when you want the system to review how rankings have changed, compare these changes to your current investments, and suggest changes that would bring your investment strategy back into sync with your specified ranking and position maintenance settings.
Portfolio Builder will create orders designed to bring these two elements back into sync, but you must manually transmit the orders.
Set the time period over which back testing results are displayed and the index against which performance is charted. Elect to optimize the weight of positions based on highest return, lowest variance or highest Sharpe ratio, and the weight of ranking providers.
Each time you make changes to the investment rules they are automatically saved. These strategies are labeled with a large "H."
Once you invest, your strategy will be marked with a large green "I" and these designations will be very clear in the "Library" of investment strategies shown in the sidecar when you first open the tool.
Once the strategy is in place and investment rules are complete, click Invest to start the investment wizard.
Enter an Investment Amount. Remember this is no longer hypothetical. If you're editing your investment rules, your current capital invested in the strategy will be displayed in the Current Capital field.
Optionally elect to round mixed and round lots. Note that applying rounding rules may impact the final investment amount. You will receive a message if the applied rounding rules result in an investment amount that is significantly higher than your original amount. For example, an odd lot of 16 shares rounded up to the nearest hundred would cost significantly more than the amount originally allotted.
Next select the order type using the Create Orders using drop down selector. Note that you will not be able to modify the order type or price before submitting orders except on this section of the wizard.
Orders to implement your portfolio strategy appear in the Orders sidecar. To make changes go back up to the appropriate section of the wizard.
To submit all orders as they appear, click "Invest Now."
Working orders will display in the Orders sidecar and in the Orders tab of the Activity panel.
Once the orders are complete you are invested in the strategy. Depending on the Rebalance setting you defined in your strategy, you will be prompted to rebalance the portfolio to re-sync it with your investment plan every interval, and every time you update the Investment Strategy.
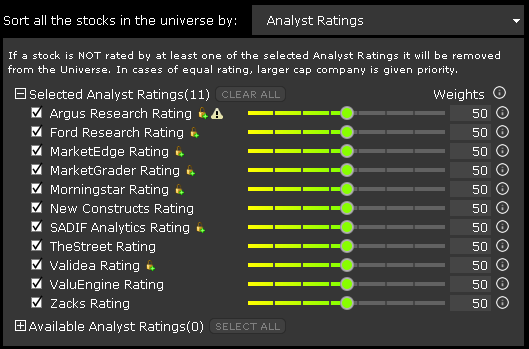
For each analyst the user selects, an analyst score is given to each stock in the set that remains after all applied filters have been satisfied, including index membership, industry, closing price range etc. The score is a basic sort, according to the analyst's rating category (i.e. 1 star 5 star) and market cap (largest market caps sorted higher for buy-rated stocks, lower for sell-rated stocks) which is nested within the category rating. These are then spread across an arbitrary interval of 0 20000 and ranked according to each stock's average analyst scores. The ranking is repeated at the close of each rebalance period (which is defined by the user).
Let's look at an example using Morningstar and TheStreet as ranking providers. Let's assume that five stocks remain after filtering. To calculate the final ranking, first we take the ratings of those stocks and assign a value on an arbitrary interval of 0 to 20,000:
Morningstar Rating | TheStreet Rating | |
---|---|---|
Stock1 | 5 Star (20000) | A+ (20000) |
Stock2 | 2 Star ( 5000) | C- ( 0) |
Stock3 | 1 Star ( 0) | B (10000) |
Stock4 | 3 Star (10000) | B+ (15000) |
Stock5 | 4 Star (15000) | C ( 5000) |
Let's use the sliders to weight Morningstar at 100% and TheStreet at 40%. In this case, the weighted averages of these stocks would be:
Ranking Calculation | Outcome | |
---|---|---|
Stock1 | (100*20000 + 40*20000) / (100 + 40) = 20000 | 1 |
Stock2 | (100* 5000 + 40* 0) / (100 + 40) = 3571 | 4 |
Stock3 | (100* 0 + 40*10000) / (100 + 40) = 2857 | 5 |
Stock4 | (100*10000 + 40*15000) / (100 + 40) = 11428 | 3 |
Stock5 | (100*15000 + 40* 5000) / (100 + 40) = 12142 | 2 |
Notice that by using the slide to weight Morningstar at 100% and TheStreet at 40%, stock 2 comes out with a higher rank than stock 3 even though TheSteet had ranked stock 3 two steps above stock 2.
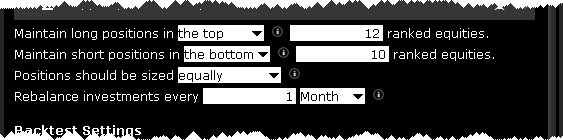
In the above example, if you buy the highest ranked two stocks and sell the lowest two ranked stocks, you'll be buying stocks 1 and 5 and selling stocks 2 and 3. But how do we know much of each we will buy and sell?
If we select equal sizing, we will purchase the same dollar amount of stock 5 as of stock 1 and sell the same dollar amounts each of stocks 2 and 3. (say buy $100k of stock 1, buy $100k of stock5, sell $100k of stock 2, sell $100k of stock3).
If we select proportional sizing, we'll buy more of stock 1 than stock 5 since it was ranked higher, and sell more of stock 3 than stock 2 since it was ranked lower. The exact amount we would buy or sell is proportional to the score and is calculated as:
Stock 1: Ranking value / (ranking value stock 1 + ranking value stock 5)
Stock 5: Ranking value/ ((ranking value stock 1 + ranking value stock 5)
Or:
Long
Stock 1 20000 / (20000+12142) = 62%
Stock 5 12142 / (20000+12142) = 38%
Short
Stock 2 16429 / (16429+17143) = -49%
Stock 3 -17143 / (16429+17143) = -51%
With the shorts, we use the numbers subtracted from the max score 20000 (e.g., 20000-3571=16439) since that makes it the mirror image of the long calculations. Notice that this is "proportional" since ratios are preserved, e.g., 20000 is to 12142 as 62% of your money in one stock vs 38% in the other. A bigger difference in scores will yield a bigger difference in allocation. For the above shorts on stocks 2 and 3 in the table above, 2857 and 3571 aren't that far apart, and so we'll be investing about the same amount: 49% compared with 51%.